20 min
Seasonality, in its simplest form, refers to the regular, cyclical variations observed within a historical data series. These fluctuations occur at periodic intervals, often following a specific pattern. As mentioned, nature provides us with an excellent example of seasonality through the changing temperatures throughout the year. Think of how spring blossoms into summer, transitions into autumn, and eventually leads to the chill of winter, all in a cyclical fashion.
Seasonality, a phenomenon deeply embedded in both nature and financial markets, is a powerful tool that enables us to decipher and predict recurring patterns within historical data. This intriguing concept exists not only in the natural world where temperature fluctuations are a prime example but also in the complex realm of financial instruments.
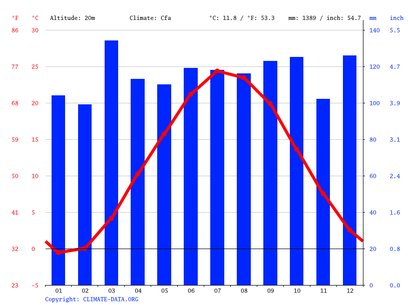
In this example we see a clear example of seasonality, the average temperatures in New York City. As can easily be seen, we find a recurring pattern, where low temperatures in the winter period alternate with higher temperatures in the summer period.
This does not exclude that in winter there may be warmer days (with above-average temperatures) or that in summer there may be cold days (with below-average temperatures), but thanks to seasonality we can know what temperature to expect at a given time of year. If you had to guess when it will be a cold day in New York City, you would certainly choose a day in January, February or December. In those months the chances of having a cold day are much higher than in months like June, July or August.
We can use this same principle in the financial markets, where thanks to seasonality we can know whether a rise or a fall is more likely to occur on a particular financial instrument in a given period of time.
Seasonality impacts every financial assets and astute investors and analysts use it to make informed predictions about market trends.
Similar to nature's cycles, financial markets also exhibit seasonal patterns. These patterns can be observed in various assets such as stocks, commodities, currencies and crypto currencies. These recurring cycles can be attributed to a multitude of factors, including economic indicators, market sentiment, and historical trends. By analyzing these seasonalities, investors and analysts can gain valuable insights into potential future price movements.
Stocks: Stock prices are subject to seasonal trends influenced by factors such as earnings reports, dividends, and market sentiment. For example, retail stocks may experience increased demand during the holiday season, leading to higher prices. Investors who recognize these patterns can adjust their portfolios accordingly.
Commodities: The prices of commodities like agricultural products (e.g., wheat, corn) and energy resources (e.g., oil, natural gas) often follow seasonal cycles. Crop prices may rise during planting and harvesting seasons, while energy prices can be affected by weather conditions. Traders who understand these patterns can make more informed decisions on when to buy or sell.
Currencies: Currency markets also exhibit seasonality, driven by economic factors such as interest rates and geopolitical events. For instance, the U.S. dollar tends to strengthen in times of global economic uncertainty, while currencies of countries heavily dependent on tourism may weaken during their off-season.
Calculating seasonality on any financial instrument is very simple, in fact all we have to do is retrieve the historical series (generally end-of-day historical series are used) year by year and average them out.
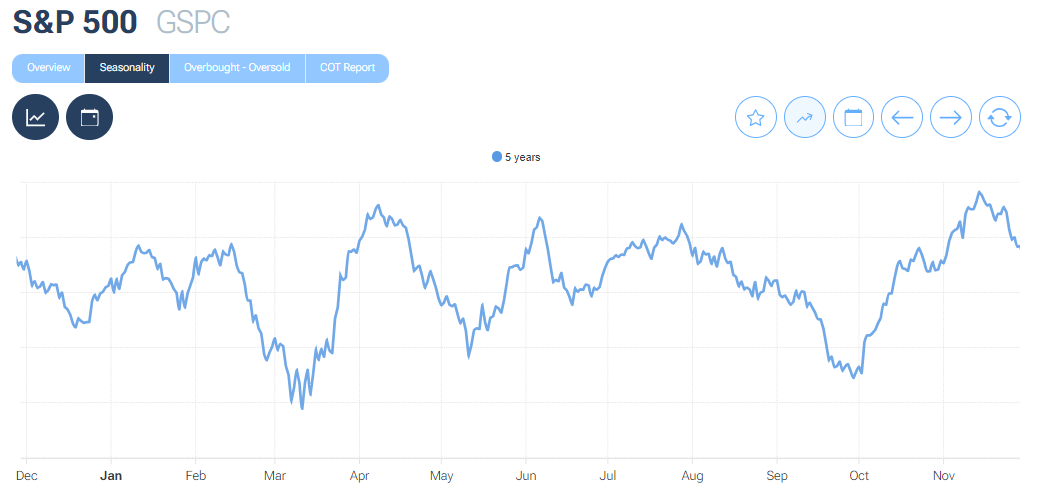
If we take the S&P 500 index as an example, we will have to retrieve the daily historical series of 2023, the historical series of 2022, the historical series of 2021 and so on for the number of years for which we want to calculate the seasonality (the Forecaster software does this calculation for the last thirty years). By mathematically averaging these time series, we will be able to identify specific recurring patterns on that particular instrument.
As can be seen from this example, once averaged, we can see specific periods of the year when upward and downward trends develop on the S&P 500 index.
The forecaster software also makes it possible to calculate detrended seasonality. The DPO (Detrended Price Oscillator) is applied to the seasonality chart, a widely used indicator in technical analysis that allows us to identify the presence of recurring cycles. With traditional seasonality it is possible to identify recurring trends on any financial instrument, with detrended seasonality we can know the time window in which a financial instrument is likely to mark important highs and lows.
To view the detrended seasonality, simply click on the X icon above the chart of the instrument you are analyzing.
The key to harnessing the power of seasonality in financial forecasting lies in data analysis and pattern recognition. Here are some steps investors and analysts can take to make the most of this valuable tool:
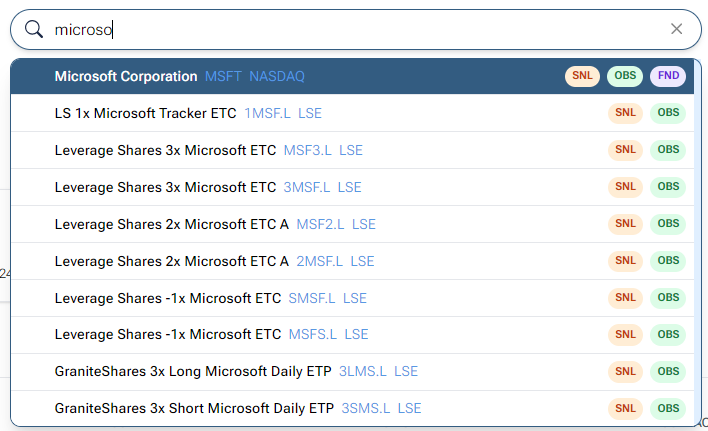
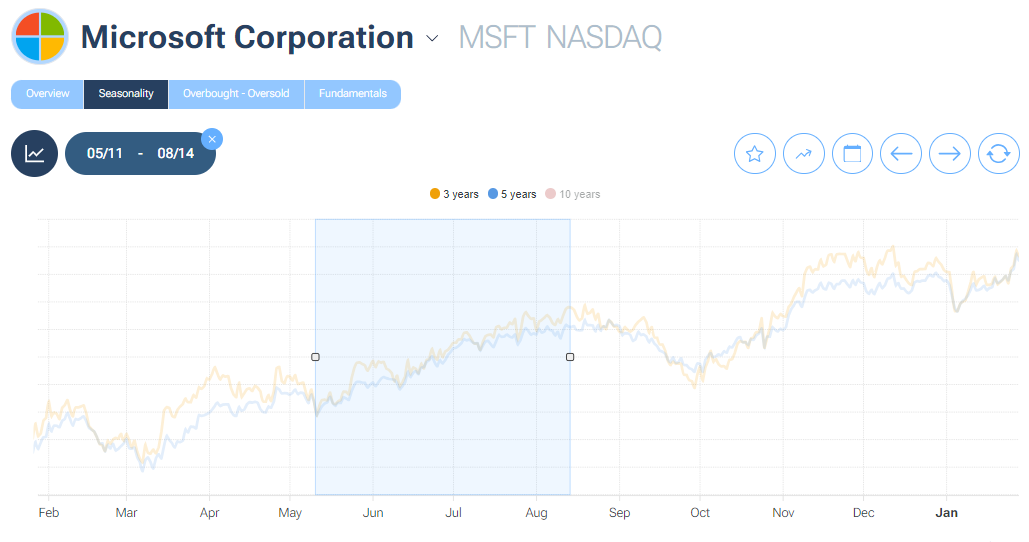
Simply type in the first letters of the instrument you are interested in, and all instruments containing those letters will appear. If we wanted to search for Microsoft stock, we would just type 'micro' to see Microsoft appear, but also all the other instruments that contain those letters.
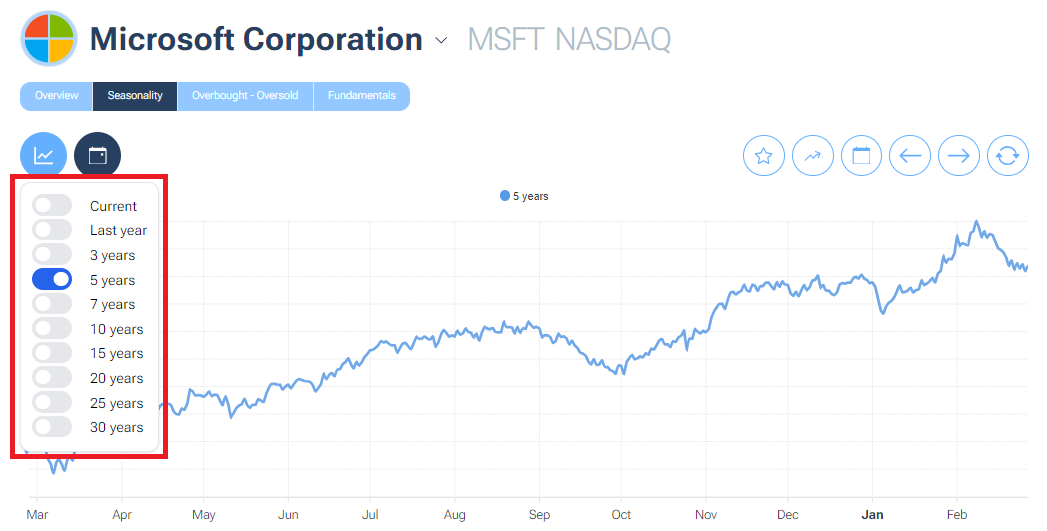
Once you click on the desired instrument, the instrument chart will appear.By default the five-year seasonality will be shown. Clicking on the icon in the top left-hand corner will open a drop-down menu from which it will be possible to activate all other seasonalities available on that instrument.
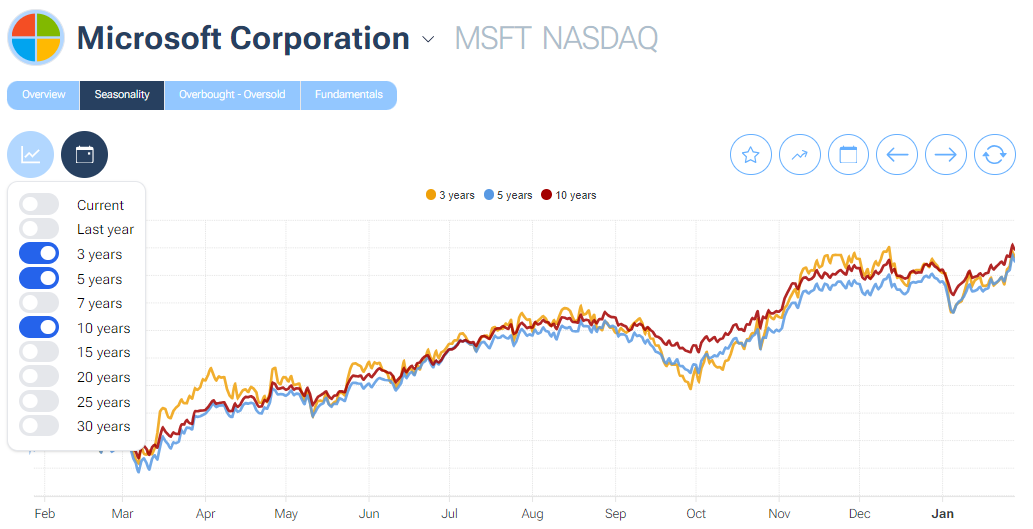
Once the seasonalities we are interested in have been selected, they will appear, in different colors, on the graph.
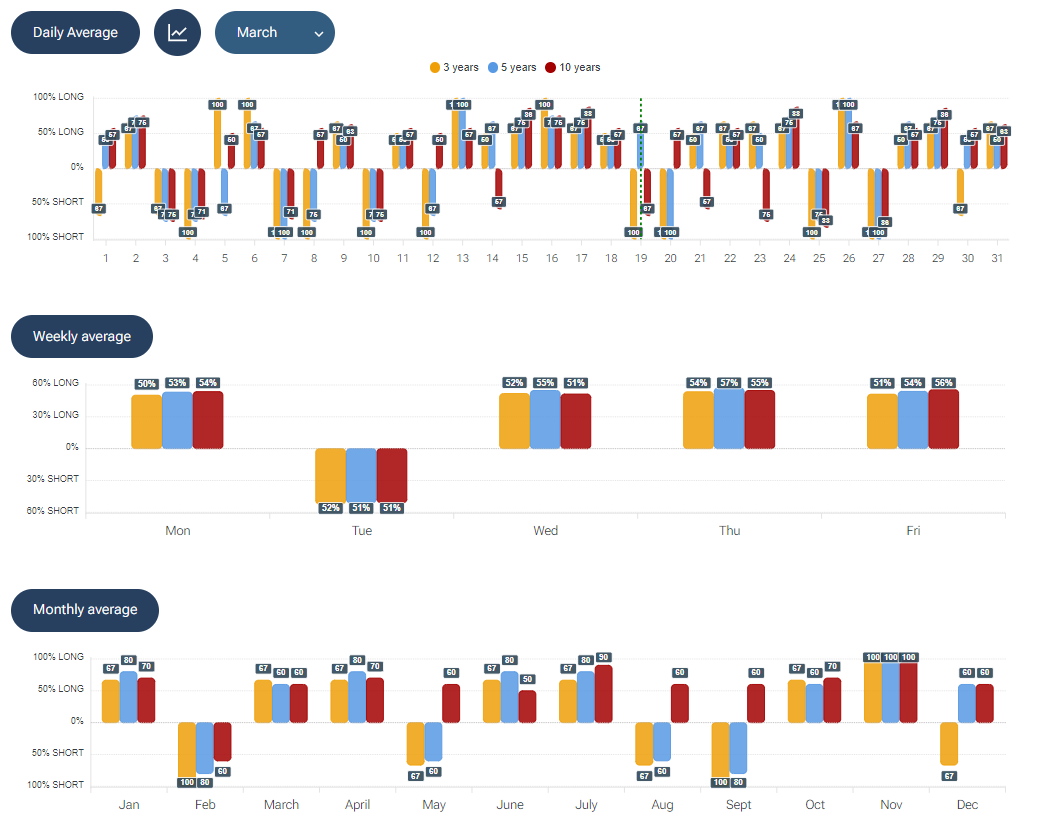
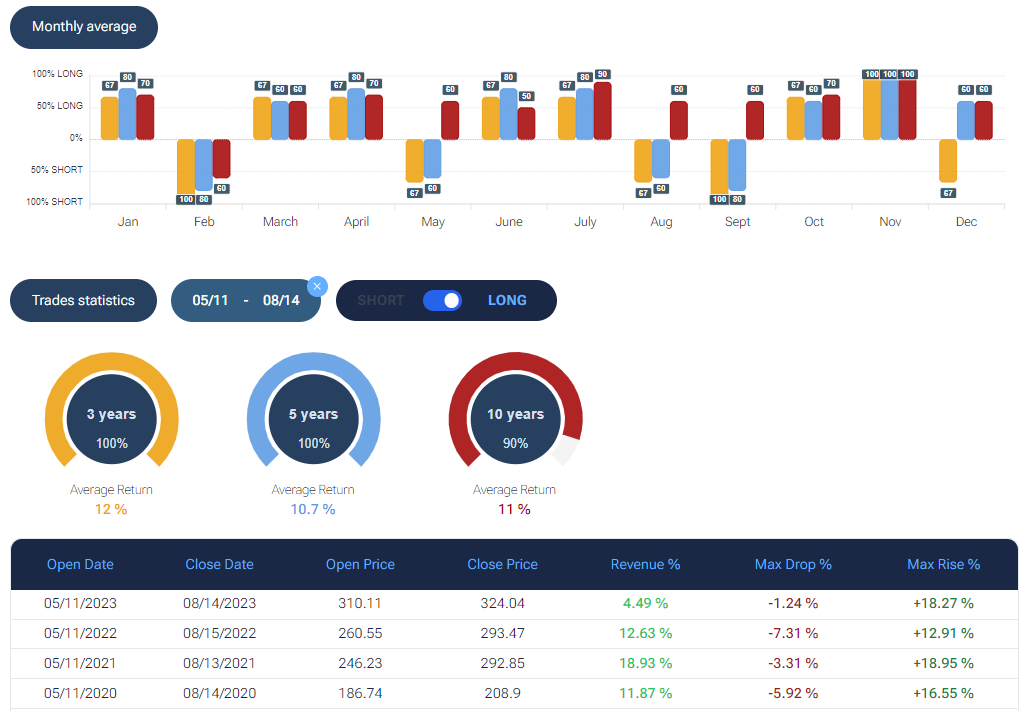
Below the graph,you can find monthly statistics for the selected seasonality as well as statistics for individual days of the week.
At this point, it is also possible to choose a specific period by selecting it on the graph.This step makes it possible to check that seasonality over a specific period is not a coincidence, but has occurred consistently over the years.
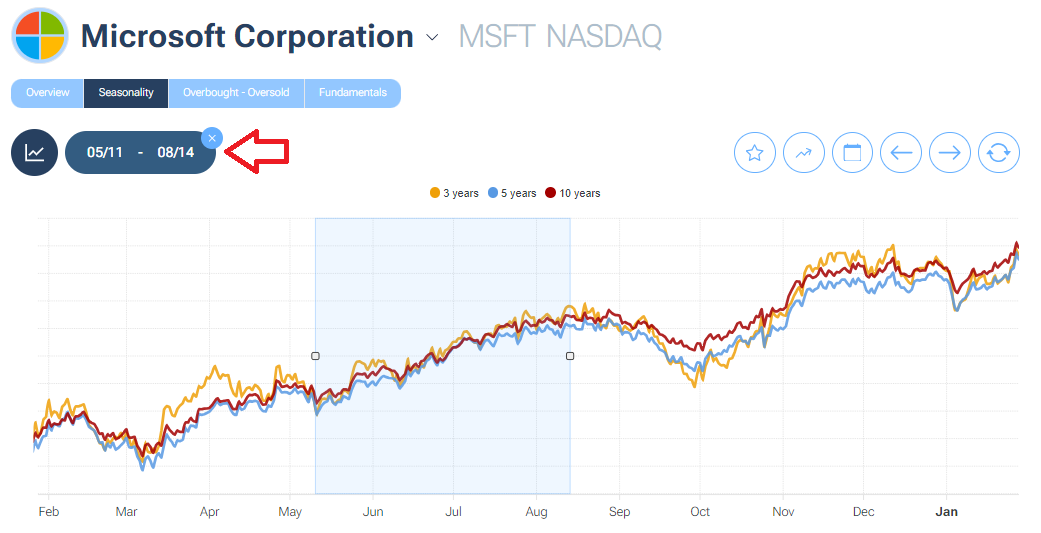
Once a specific period is selected,the weekly statistics are updated, and the statistics of a possible trade (up or down) for that specific period appear. The software also reports statistics for each individual year for the selected period.
You can temporarily switch the seasonality on or off on the graph by clicking on the relevant seasonality at the top of the graph.This will allow the time series to be analysed quickly.
Risk Management: It's important to remember that while seasonality can provide valuable insights, it is not a guaranteed predictor of future prices. Risk management and diversification remain essential in any investment strategy.
It is advisable to complement the utilization of seasonality with a diverse set of trading and analytical techniques. While seasonality can provide valuable insights into the general trend of a financial instrument, it often falls short when it comes to pinpointing the optimal entry points. This precision in timing, crucial for successful trading decisions, is more effectively achieved through methods such as technical analysis. Seasonality, with its focus on historical patterns and cyclicality, excels at helping traders "anticipate" or "foresee" the broader directional movements of an asset. It grants them the ability to understand when certain seasonal trends are likely to manifest, offering a sense of the asset's expected behavior over time. However, the art of market entry requires a different set of tools, where technical analysis shines. Technical analysis provides traders with the means to scrutinize price charts, identify key support and resistance levels, recognize chart patterns, and employ indicators. These elements combine to empower traders with the "precision" or "timing" aspect of their trades. By using technical analysis, traders can refine their entries to coincide with opportune moments in the market, enhancing the probability of favorable outcomes. In essence, seasonality serves as a valuable foundational element in the trader's toolkit, providing an understanding of the broader market rhythms. Yet, it should be harmoniously integrated with techniques like technical analysis that offer the finesse required to execute well-timed and strategically sound trades. This holistic approach enables traders to not only anticipate market trends but also to navigate the complex landscape of entry and exit points with greater precision and confidence.
Technical analysis lends itself very well to working in synergy with seasonality; in fact it can tell us which is the correct time to enter, up or down, on a given market.
We can therefore identify a market where we expect a particularly pronounced movement (such as the end-of-year rally in the S&P 500) and wait for an entry signal from technical analysis. The combination of seasonality and technical analysis greatly increases the probability of a successful trade, as it only allows trades to be made in the direction of what has been an established trend for years.
Just as it is very difficult to 'get it right' on a sunny day with high temperatures in the middle of winter, the same applies to the financial markets... Why go long at a time when, historically, that market/currency/commodity has gone short?
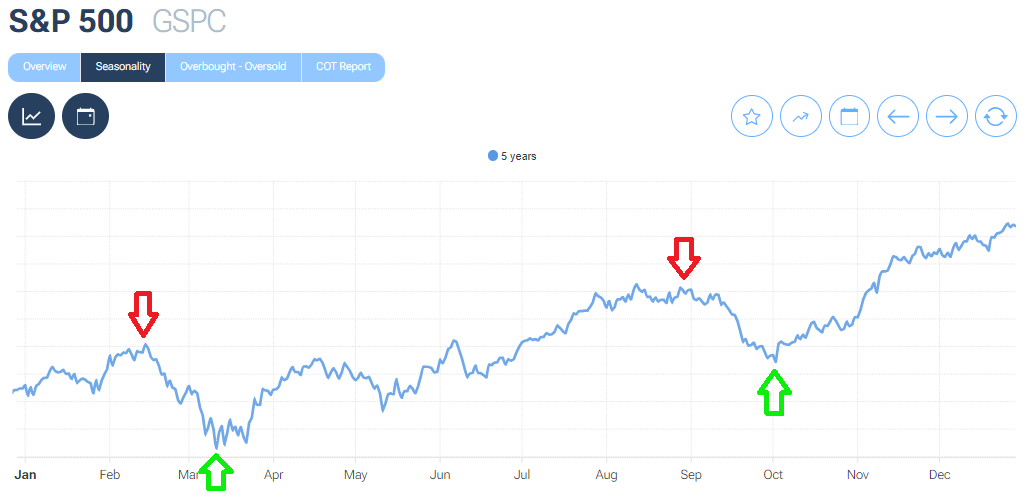
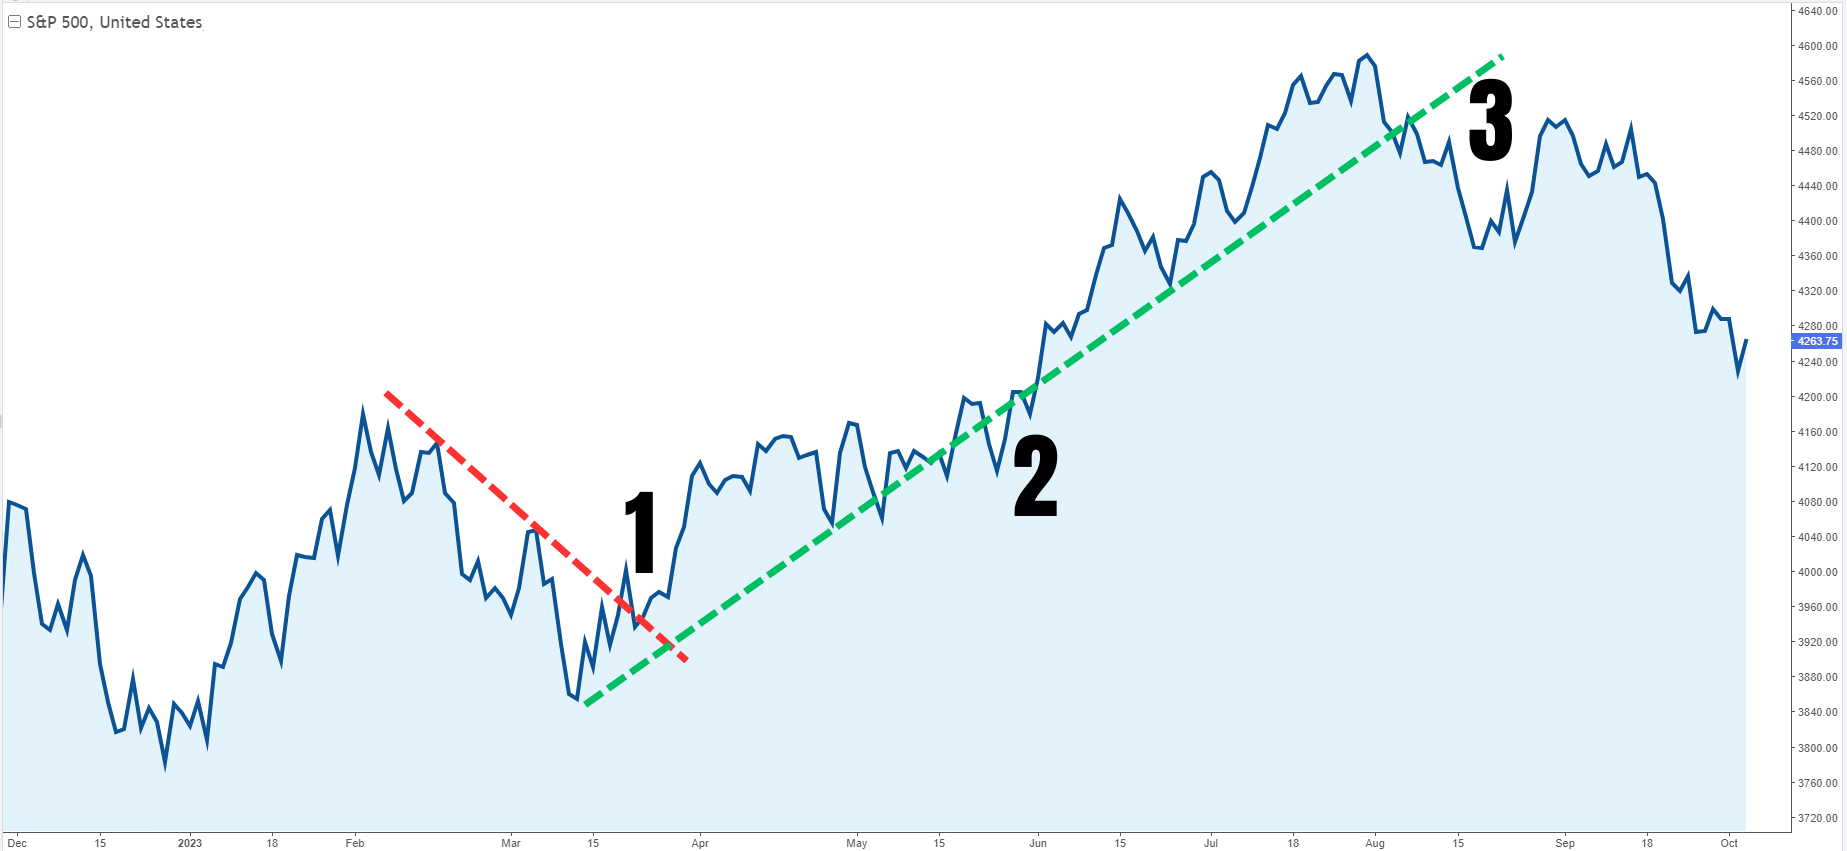
Trend lines are a tool of technical analysis that is as simple as it is effective. Used with seasonality, they are even more powerful.
In the image below we see 3 different cases:
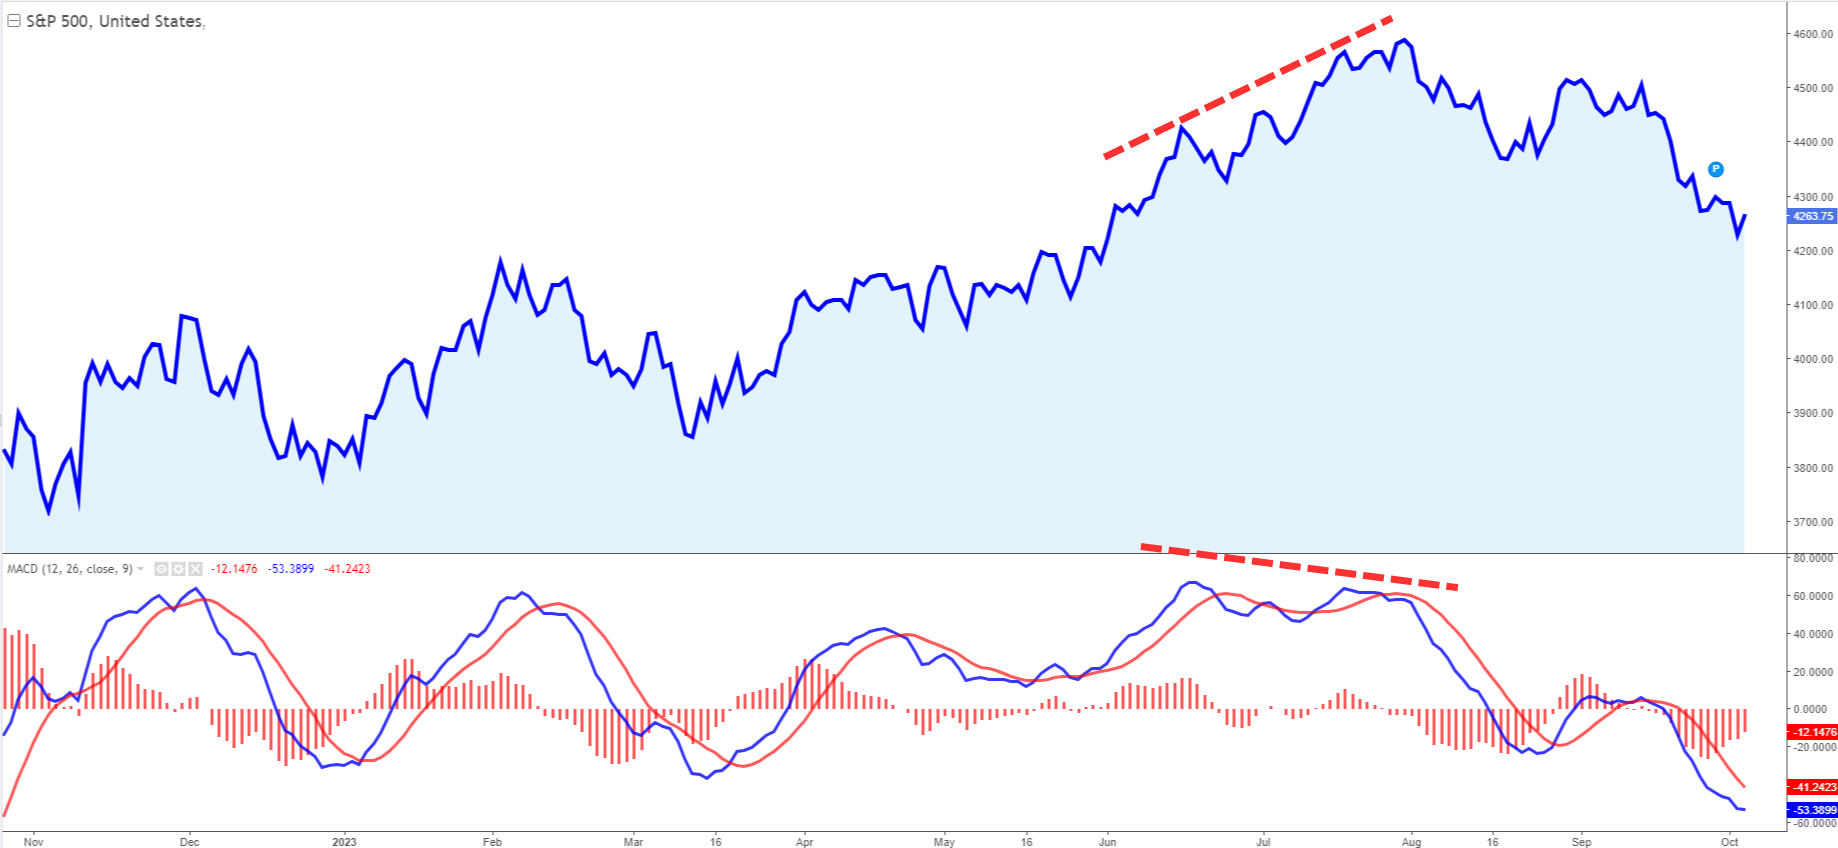
Indicators and oscillators can also be used in synergy with seasonality. Particularly useful are all those that can give us indications of overbought and oversold, and all those indicators that signal divergences with price.
In the image below we see the DAX index with the MACD applied, one of the most widely used momentum indicators. The highs at the end of June were marked in conjunction with lower MACD prices (divergence), which in most cases indicates an imminent trend change.
Spread trading is a strategy in financial markets where an investor simultaneously buys one financial instrument and sells another related financial instrument, often in the same or closely related markets. The goal of spread trading is to profit from the relative price movements between the two instruments, rather than relying solely on the outright direction of a single asset. Seasonality can be incorporated into spread trading strategies to enhance their effectiveness.
Here's an overview of spread trading and how you can use seasonality in this trading approach. Spread Trading Basics:
Instrument Selection: Choose two financial instruments that are related or have a historical correlation. These instruments could be in the same asset class (e.g., two different stocks in the same sector) or different asset classes (e.g., a stock and a commodity). The key is to identify a relationship that may be influenced by seasonality.
Long and Short Positions: In spread trading, you take a long (buy) position in one instrument and a short (sell) position in the other. This means you are betting that the long instrument will outperform the short instrument.
Equal Dollar Amount: It's common to trade equal dollar amounts of both instruments to balance the exposure. For example, if you go long on $10,000 worth of stock A, you would simultaneously go short on $10,000 worth of stock B.
Profit Mechanism: You profit from the spread between the two instruments. If the long position outperforms the short position, the spread widens, and you make a profit. Conversely, if the short position outperforms the long position, the spread narrows, and you incur a loss.
Here are the steps to follow to use seasonality in synergy with spread trading.
Identify Seasonal Patterns: Analyze historical data for both instruments to identify seasonal patterns or trends. Look for instances where the spread between the two instruments has historically widened or narrowed during certain times of the year.
Entry and Exit Timing: Use the insights from seasonality analysis to time your entry and exit points for the spread trade. For example, if seasonality suggests that Stock A tends to outperform Stock B during a specific quarter, you may initiate a spread trade by going long on Stock A and short on Stock B at the beginning of that quarter.
Risk Management: Implement robust risk management practices. Determine stop-loss levels and profit targets for your spread trade to limit potential losses and secure profits.
Monitoring and Adjustment: Continuously monitor the spread between the two instruments and be prepared to adjust your positions as necessary. If the spread starts moving against your position, consider whether seasonality still supports your trade, and make adjustments accordingly.
Diversification: Spread trading allows you to diversify your portfolio by being exposed to two different assets. This can help mitigate risk. However, it's important to manage your exposure carefully and ensure that you understand the dynamics of both instruments.
Stay Informed: Keep abreast of developments in the markets and any factors that may affect the relationship between the two instruments. Market conditions can change, and seasonality may not always hold.
Spread trading using seasonality can be a powerful strategy when executed thoughtfully. It allows traders to leverage historical patterns to identify potential opportunities and manage risk effectively. However, like any trading strategy, it involves risk, and it's essential to conduct thorough research and analysis before implementing spread trades based on seasonality.
You can use this strategy either with very similar stocks (the classic example is Coca Cola vs Pepsi orVisa vs Mastercad ) or you can use sector ETFs of the S&P 500 index.
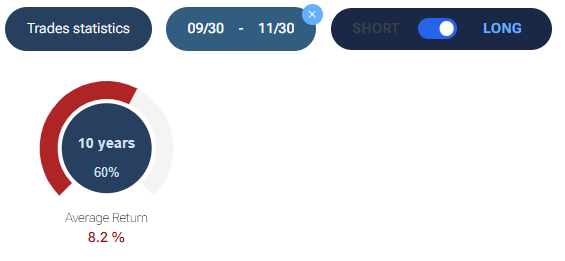
Here is a practical example using the Financial Select Sector SPDR Fund ETF (Ticker XLF) and the VanEck Vectors Gold Miners ETF (Ticker GDX). Using statistics over the past ten years, we see that the GDX ETF has only gone up 50% of the time, with an average return of 6.6%.
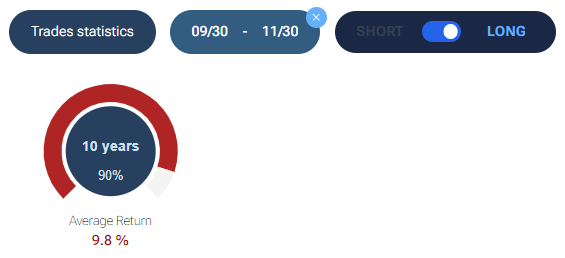
The XLF ETF, on the other hand, went up 90% of the time over the same period, with an average performance of 9.8%.
The trader who wanted to use the spread trading strategy would have to position himself upwards (long) on XLF and downwards (short) on GDX. If past statistics should hold true, the trader/investor would gain from the difference in performance of the two financial instruments.
If you deal with the financial markets, you have surely heard the saying: 'Sell in May and Go Away', a strategy of selling all your stock positions on 1 May and buying them back immediately after Halloween, i.e. on 31 October.
The phrase "Sell in May and go away" is shrouded in historical mystery, with its roots believed to trace back to old England. Legend has it that this adage emerged in a time when stockbrokers, adhering to tradition, would embark on summer vacations in May and wouldn't return to work until the arrival of September. In its original form, the saying went, "Sell in May and go away, do not return until St. Leger's Day." The significance of St. Leger's Day lay in it being the final horse race of the season, signaling that the old-fashioned stockbrokers had no intention of resuming work until the racing season had drawn to a close.
This quaint saying has garnered credibility among investors, primarily due to the striking historical instances of stock market declines during the May-through-October period. These instances include the infamous Black Monday crash of 1987, the tumultuous post-Lehman Brothers crash in 2008, and the correction in August 2011, which followed the downgrade of the U.S. government debt rating. These events have lent weight to the notion that steering clear of the stock market during this traditionally turbulent period might be a prudent strategy.
Do stock market indices really fall at this time?
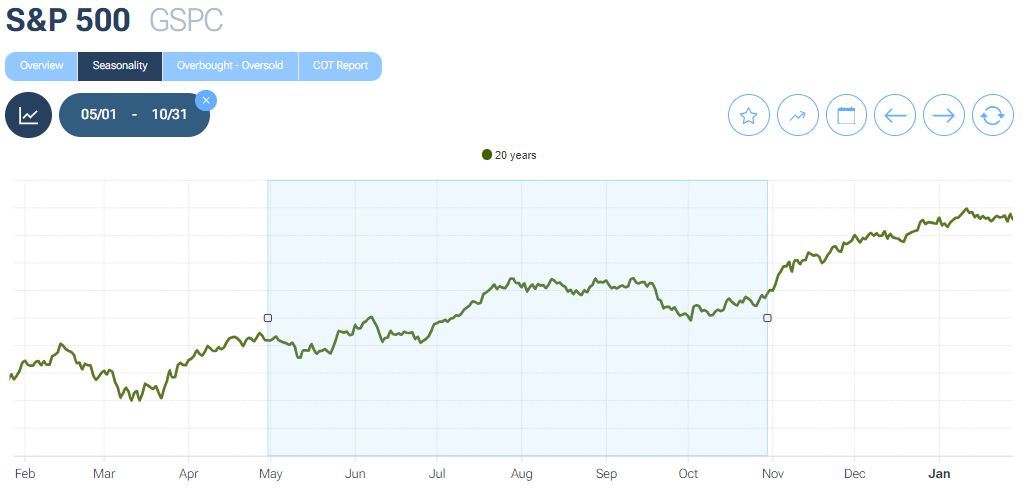
To do this, simply choose the number of years over which we want to calculate the statistic (in this example we will calculate over the last 20 years), then select the period we are interested in (i.e. 1 May to 31 October). To do this, we can select the dates from the calendar, or select the period directly from the graph by selecting the dates with the mouse. Here is the example below, on the S&P500 index:
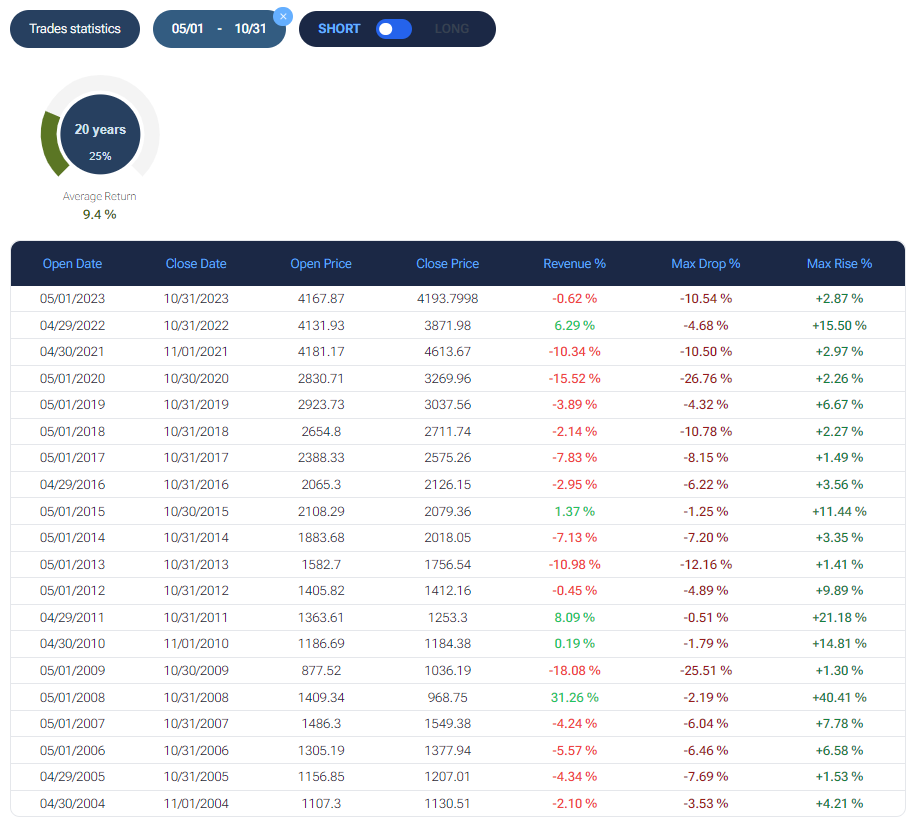
The first thing we notice is that, in this selected period, the market trend has been positive. If we then look at the individual years (the data are available in the seasonality statistics of the forecaster) we realize that the saying 'Sell in May and go away' does not work! Following this strategy, in fact, we would only make a profit in five cases out of twenty. In two of these cases (in the years 2015 and 2010), the performance was +1.37% and +0.19% respectively, therefore negligible.
The Santa Claus rally is a seasonal trading tactic that recommends acquiring stocks during the final period of the year, and retaining them until the first two trading days of January. The underlying concept behind this strategy is that investors can capitalize on the festive atmosphere and heightened optimism that often prevail during the holiday season to potentially yield profitable returns.
Does this strategy really work?
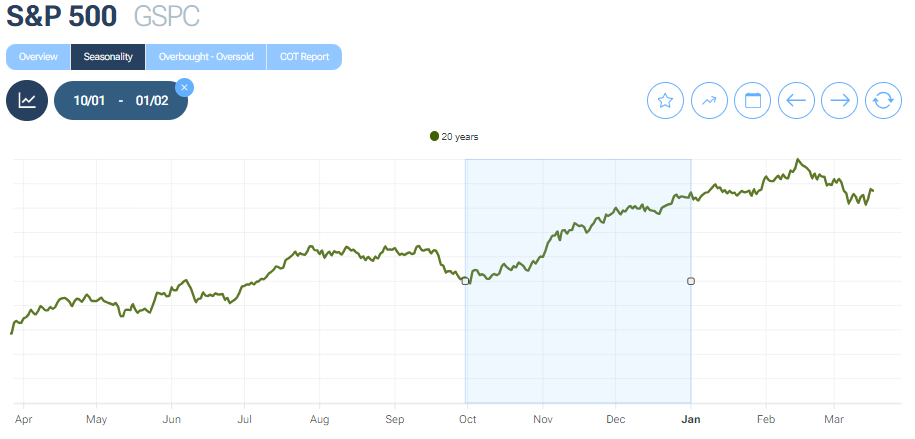
To do this, simply choose the number of years over which we want to calculate the statistic (in this example we will calculate over the last 20 years), then select the period we are interested in (i.e. 1 October to 2 January). To do this, we can select the dates from the calendar, or select the period directly from the graph by selecting the dates with the mouse. Here is the example below, on the S&P 500 index:
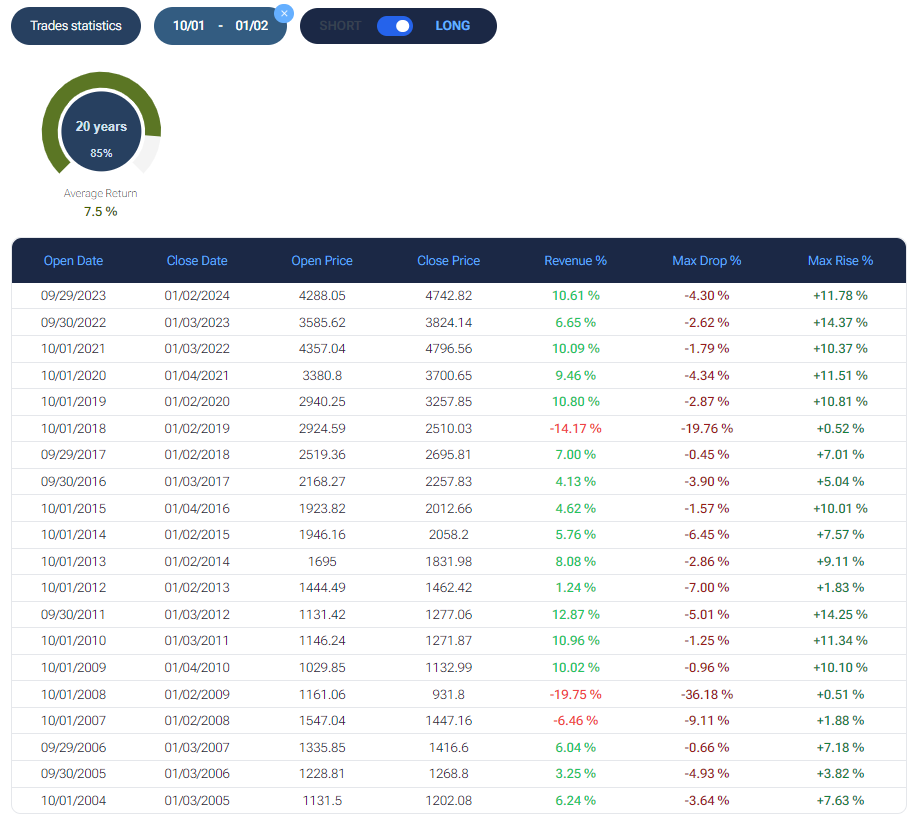
The first thing we see is that in this time window the trend over the last twenty years has been bullish on average. If we then look at the precise statistics, we see that over the last twenty years, in this time window, prices have performed positively in 85% of the cases, with an average return of +7.4%. Over the past twenty years, there have only been three years in this time period in which a negative performance has been recorded, one of these being in the year 2008, a year sadly remembered for the subprime mortgage crisis. So yes, the Santa rally really does exist.
Analyse the seasonality for every listed company now!
19th March, 2024