How to calculate the value of the stockJoin our free webinar on April18,2024.
Best Stock Market Analysis & Decisions
for Traders and Investors with
Forecaster Terminal
Forecaster works on all financial instruments.

Forex

Indexes

Commodities

Stocks

Cryptos

ETFs
What is the Forecaster?
The Forecaster Terminal is a powerful financial software that offers a comprehensive suite of tools designed to analyze financial instruments from both statistical and fundamental perspectives. With the ability to assess global financial markets, stocks, commodities, and currencies, the Forecaster Terminal empowers traders and investors to make well-informed decisions in a matter of seconds. Whether you're a seasoned trader or just starting your investment journey, the Forecaster Terminal equips you with the essential tools to navigate the financial markets with confidence.
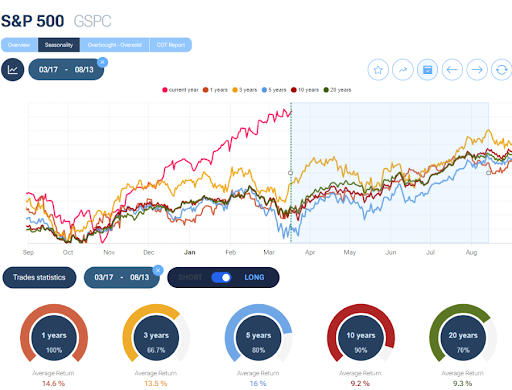
Seasonality
Seasonality in financial markets refers to recurring patterns during the year. These patterns are influenced by various factors, offering traders and investors opportunities to make informed decisions. with Forecaster you can discover these patterns on all the world's financial instruments, going back as far as thirty years.
Learn more about Seasonality
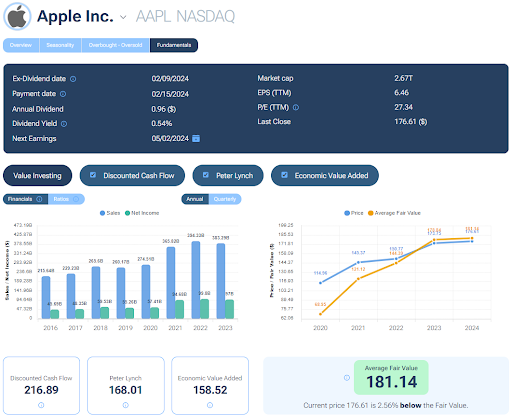
Fundamentals
Value investing targets undervalued stocks for long-term gains, using fundamental analysis for safety. Forecaster assesses stock values globally with Discounted Cash Flow, Peter Lynch's method, and Economic Value Added, evaluates financial health via Haltman's Z score, and tracks insider transactions.
Learn more about Value Investing
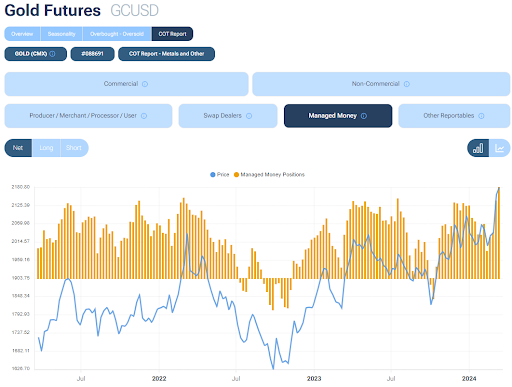
COT Report
The COT Report tracks futures trading positions, revealing market sentiment and trends among key traders. It provides insights into commodities, currencies, and futures, aiding in predicting price movements and informing strategic decisions.
Take a look at COT Reports
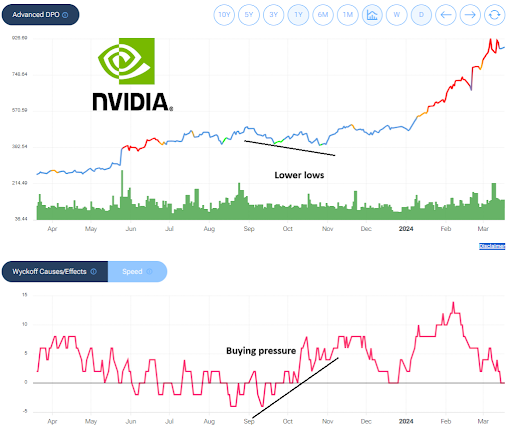
Overbought/Oversold
Financial Markets are cyclical, with the overbought/oversold tool it is possible to know whether the prices of any financial instrument are close to a possible minimum or maximum price.
Start finding the best trading and investment opportunities,register with Forecaster from here and try our software for free!